|
|
|
1.
|
A doctor wants to test the effectiveness of a new
drug on her patients. She separates her sample of patients into two groups and administers the
drug to only one of these groups. She then compares the results. Which type of study
best describes this situation?
A) | census | B) | survey | C) | observation | D) | controlled
experiment |
|
|
|
2.
|
A manufacturer is trying to determine how to test a
product for safety. Which method would best determine that the product is
safe?
A) | test every unit of the product from one manufacturing plant | B) | test every unit of
the product made on a particular day | C) | test randomly selected units of the product
made in all manufacturing plants | D) | test randomly selected units of the product
made from one manufacturing plants |
|
|
|
3.
|
A research team is conducting the following
research projects:
Project I -- Does taking vitamins decrease the
chance of getting sick?
Project II -- Do more people in rural areas
have vegatable gardens?
Project III -- Does using a certain brand
of lotion improve dry skin?
Project IV -- Do people who listen to
classical music have better test scores?
Which of the projects would best be conducted using an
observational study rather than a randomized experiment?
A) | Project I | B) | Project II | C) | Project III | D) | Project
IV |
|
|
|
4.
|
What is missing from the box-and-whisker
plot?
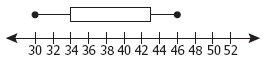
A) | Median | B) | Range | C) | Upper quartile | D) | Lower
quartile |
|
|
|
5.
|
Which measures can be determined using data presented in a box-and-whisker
plot?
 A) | The interquartile range and the number of data points | B) | The median and the
mode | C) | The mean and the upper quartile | D) | The interquartile range and the
median |
|
|
|
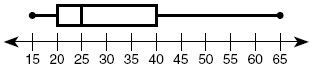
6.
|
Based on the box-and-whisker plot below,
| which statement is
false? | 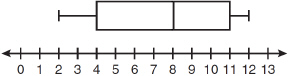 | | |
A) | The lower extreme is 2. | C) | The interquartile range is 10. | B) | The upper quartile is 11. | D) | The lower quartile
is 4. |
|
|
|
7.
|
The number of points two basketball teams scored is
summarized in these two box-and-whisker plots.
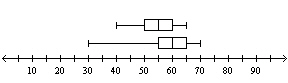
Team A scored a different number of points in each of the team’s 14
games.
Team B scored a different number of points in each of the team’s 13
games.
What is the total number of games that Team A and Team B scored 55 or more
points?
|
|
|
8.
|
The accompanying box-and-whisker plots can be used to compare the annual incomes of three professions.
Based on the box-and-whisker plots, which statement is
true? | 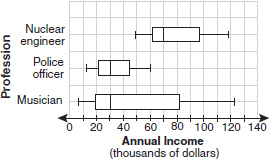 | | |
A) | The median income for nuclear engineers is greater than the income of all
musicians. | B) | The median income for police officers and musicians is the same. | C) | All nuclear
engineers earn more than all police officers. | D) | A musician will eventually earn more than a
police officer. |
|
|
|
9.
|
What is the range of the numbers
listed?
76, 59, 91, 22, 43, 57, 89, 76, 31
|
|
|
10.
|
A movie theater recorded the number | of
tickets sold daily for a popular movie during the month of October. The box-and-whisker plot
shown represents the data for the number of tickets sold, in the hundreds. | 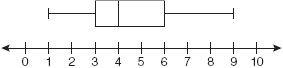 | | |
Which conclusion can be made using this plot? A) | Twenty-five percent of the attendance is between 400 and 900.. | B) | The range of the
attendance is 300 to 600. | C) | The interquartile range of the attendance is
800. | D) | The range of attendance is 800. |
|
|
|
11.
|
What value represents the smallest| upper-end outlier for the
data plotted in the box-and-whisker plot? | 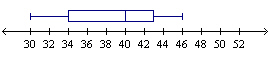 | | |
|
|
|
12.
|
What value represents the largest| lower-end outlier for the
data plotted in the box-and-whisker plot? | 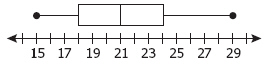 | | |
|
|
|
13.
|
The scatterplot shows the number of free
throws Calista made in six basketball games.
For game seven, which number of free throws that
she could make would be considered an outlier? | 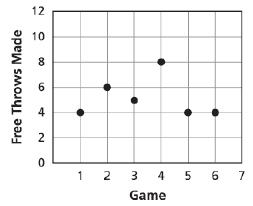 | | |
|
|
|
14.
|
What is the median of the following list of
numbers? 33, 21, 42, 19, 42, 12
|
|
|
15.
|
Mr. Murphy asked 24 of his students how many miles they live
from the school. The stem-and-leaf plot shows the
data.
| 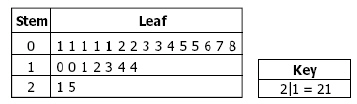 | | |
Which of the
following is a true conclusion based on the data in the stem-and-leaf plot?
A) | Five students live 1 mile from the
school. | B) | Three students live 4 miles from the
school. | C) | Exactly half the students live 7 or more miles from the
school. | D) | The maximum distance a student lives from the school is
15 miles. |
|
|
|
16.
|
A clerk recorded the number of pairs of shorts sold each day at a
store. The data are displayed on the stem-and-leaf
plot.
Which of the following statements is true according to the data in the stem-and-leaf
plot? | 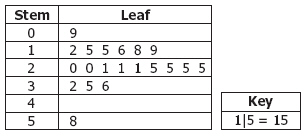 | | |
A) | The number of pairs of shorts sold each day was between
0 and 8. | B) | The stem-and-leaf plot displays 26 days of
sales. | C) | The median for the data is
25. | D) | The mode for the data is
25. |
|
|
|
17.
|
Tim wants his mean (average) quiz score in history
class to be 90. His first 3 quiz scores were 86, 92, and 94. What score should he make on the 4th
quiz in order to have a mean (average) quiz score of exactly 90 ?
|
|
|
18.
|
A school club listed the attendance at its weekly
meetings as follows.
12, 9, 20, 15,
13, 8, 16, 12, 18, 10, 26, 14, 24, 17, 18
Which statement is best supported by the
data?
A) | There is no mode. | C) | There
are only two modes. | B) | There is only one
mode. | D) | There are three modes. |
|
|
|
19.
|
Look at the table.
Based on the ages of the Lopez family members, which of the following has
the greatest value? | 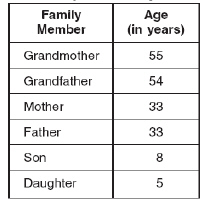 | | |
A) | Mean | B) | Median | C) | Mode | D) | Range |
|
|
|
20.
|
Look at the table showingthe average travel time to school
for students in Mrs. White’s science
class.
What is the
range for the times listed in the table? | 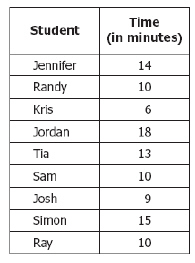 | | |
A) | 4 min | B) | 9 min | C) | 10 min | D) | 12
min |
|
|
|
21.
|
Which is closest to the mean | (average) high temperature for
Oakwood City? | 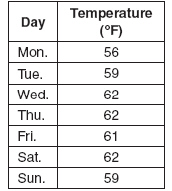 | | |
|
|
|
22.
|
Look at the table describing thenumber of customers at MacAdos
this past week.
According to the table, what was the median number of customers? | 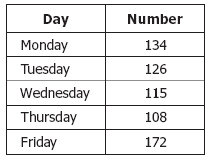 | | |
|
|
|
23.
|
The table shows high temperatures for four Virginia
cities during one week in March.
March High Temperaturs (degrees Fahrenheit)
Day | Arlington | Marion | Hampton | Roanoke | Sunday | 52 | 52 | 63 | 50 | Monday | 70 | 71 | 70 | 73 | Tuesday | 74 | 75 | 65 | 78 | Wednesday | 66 | 70 | 57 | 68 | Thursday | 56 | 53 | 59 | 55 | Friday | 50 | 70 | 48 | 71 | Saturday | 63 | 73 | 54 | 72 | | | | | |
Which city had the greatest mean
high temperature during this week?
A) | Arlington | B) | Marion | C) | Hampton | D) | Roanoke |
|
|
|
24.
|
A data set contains the numbers 691, 313, 324, 244,
and 244. What will happen to the mean and median of this data set, if the number 486 is added
to the list?
A) | the mean and the median will both
increase | B) | the mean and the median will both
decrease | C) | the mean will increase and the median will
decrease | D) | the mean will decrease and the median will
increase |
|
|
|
25.
|
In a class of 15 students, each student has a
different test score. The median test score is 79. How many students scored higher than
79?
|