|
|
|
1.
|
Which equation is | represented by this
line? | 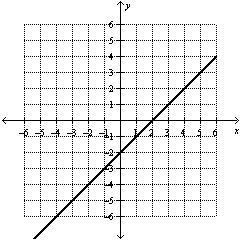 | | |
A) | y = x + 2 | B) | y = –x –
2 | C) | y = –x + 2 | D) | y = x –
2 |
|
|
|
2.
|
Which line on the graph | has an positive
slope? | 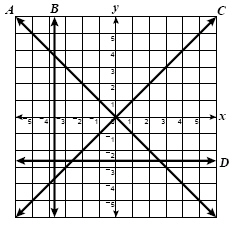 | | |
|
|
|
3.
|
The line on the grid is best | described by the equation --- | 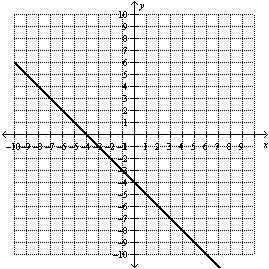 | | |
A) | y = x + 4 | B) | y = x –
4 | C) | y = –x + 4 | D) | y = –x –
4 |
|
|
|
4.
|
The graph of  is shown.
If the line in the graph is shifted up 3 units, which is the equation of the new
line? | 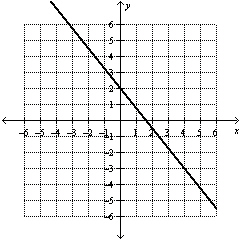 | | |
|
|
|
5.
|
The graph below represents the equation y = 2x.
Which graph best represents
y =
2x + 1? | 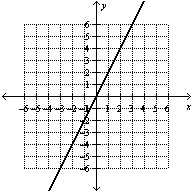 | | |
|
|
|
6.
|
Which equation best | describes this
graph? | 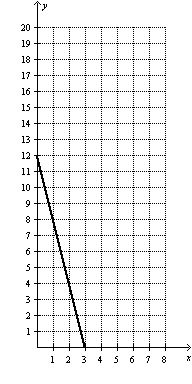 | | |
|
|
|
7.
|
Which best represents the | equation of the line shown? | 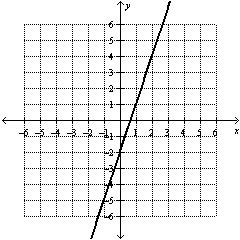 | | |
A) | y = –3x + 2 | B) | y = –3x –
2 | C) | y = 3x + 2 | D) | y = 3x –
2 |
|
|
|
8.
|
Which line on the graph | has an negative
slope? | 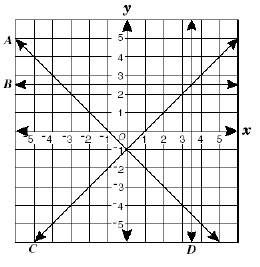 | | |
|
|
|
9.
|
Jack works at a local restaurant and
is paid $4.30 per hour plus tips. The graph shown describes his salary, S, based on the
number of hours, t, he works (without tips).
Which is an equation of
the graph shown? | 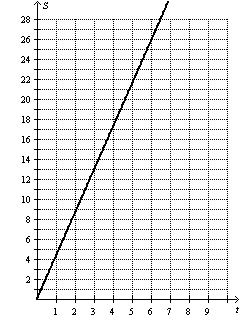 | | |
A) | S = 4.30 + t | B) | S =
4.30t | C) |  | D) |  |
|
|
|
10.
|
Which equation best | describes this
graph? | 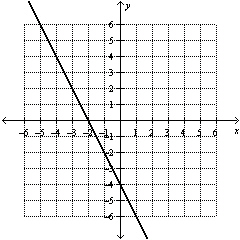 | | |
A) | y = 2x + 4 | B) | y = 2x –
4 | C) | y = –2x + 4 | D) | y = –2x –
4 |
|
|
|
11.
|
This graph represents 
If the line in the
graph is shifted down 3 units, which is the equation for the new line? | 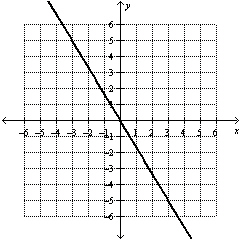 | | |
|
|
|
12.
|
What is most likely the slope
| of the line graphed
on the coordinate plane? | 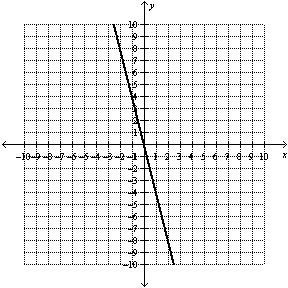 | | |
|
|
|
13.
|
Which graph best represents the equation of the
line  ?
|
|
|
14.
|
Which line has y-intercept –6 and x-intercept
2?
|
|
|
15.
|
Which is the graph of a line that appears to have a slope of –3 and
y-intercept 3?
|
|
|
16.
|
Which of the following is most likely a graph of y = 4x –
2?
|
|
|
17.
|
Which graph best represents a line with a y-intercept of 2 and
slope 3?
|
|
|
18.
|
Which line has a y-intercept of 4 and an x-intercept of
–2?
|
|
|
19.
|
What is the apparent slope | of
the line graphed? | 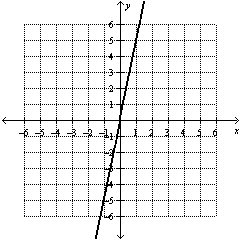 | | |
|
|
|
20.
|
Which of the following is most likely the graph of a line with a slope of
zero?
|
|
|
21.
|
Which graph best represents the following
function? y =
–3x + 3?
|
|
|
22.
|
The dashed line on each grid represents y = x.
On which
grid is y = 3x – 3 apparently represented as well?
|
|
|
23.
|
What is closest to the slope | of
the line graphed below? | 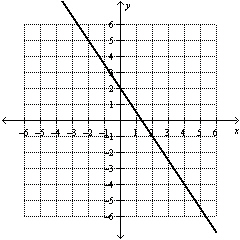 | | |
|
|
|
24.
|
Which of the following is most likely the graph of a line with a negative
slope?
|
|
|
25.
|
The graph below represents the equation y = 3x.
Which graph best represents
y =
3x + 3? | 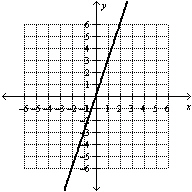 | | |
|