|
|
|
1.
|
If A < B, which of the following statements is always
true?
A) |  | B) | 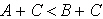 | C) | AC <
BC | D) | -A < -B |
|
|
|
2.
|
What is the solution to 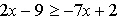 ?
|
|
|
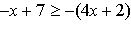
3.
|
If 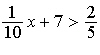 , then --- A) | x > –66 | B) | x >
–3 | C) |  | D) | x >
74 |
|
|
|
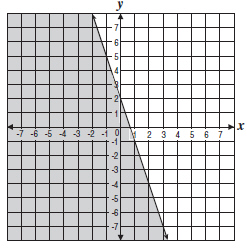
4.
|
Which best represents the graph
of  ?
|
|
|
5.
|
Which of the following inequalities best represents the graph
below?
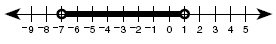 A) | |x - 1| < 3 | B) | |x - 7| < 4 | C) | |x + 3| <
7 | D) | |x + 3| < 4 |
|
|
|
6.
|
Which number line shows the correct solution to the inequality  ?
|
|
|
7.
|
Halley wants to by two different type of ground covering for her yard. She
plans to spend no more than $750 in all. She found wood mulch for $30 per cubic yard and ground
pebbles for $50 per cubic yard, taxes included. Which of these graphs best represents the
numbers of cubic yards of each type of ground covering Halley can buy?
|
|
|
8.
|
Which statement describes the values of x
that satisfy the inequality -3x < 6?
A) | x is less than 9. | C) | x is greater than 9. | B) | x is
less than -2. | D) | x is greater than -2. |
|
|
|
9.
|
Which graph represents the inequality  ?
|
|
|
10.
|
What is the solution to this inequality?
|
|
|
11.
|
Which inequality matches this number line?
|
|
|
12.
|
Which inequality is shown on the graph below?
|
|
|
13.
|
Which inequality does the shaded region of the graph
represent?
|
|
|
14.
|
Which graph best represents the solution to the system of linear
inequalities? 
|
|
|
15.
|
Which of these shows the inequality  ?
|
|
|
16.
|
Which graph shows the values of x that satisfy the
inequality? 
|
|
|
17.
|
Which system of inequalities is best represented by the shaded region of
this graph? 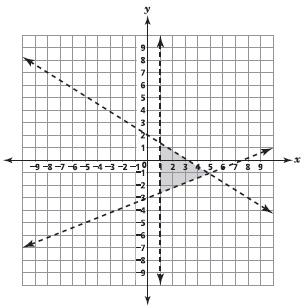
|
|
|
18.
|
A group of high school students wants to earn at least $200 in profits by
selling no more than a total of 250 hot dogs and hamburgers at a basketball game. They make
50¢ on every hot dog and a dollar on every hamburger. 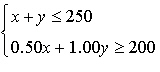 This system of inequalities represents the number of hot dogs, x, and the number of hamburgers, y, the students can sell to meet their goal. Which graph represents
this situation?
|
|
|
19.
|
Which quadrants contain the solutions to this system of
inequalities?  A) | I and IV | B) | II and III | C) | III and IV | D) | II, III, and
IV |
|
|
|
20.
|
India and Sal are starting a lawn mowing company.
They have to buy a lawn mower for $250. They will charge $25 per lawn. Which of these inequalities
represents the least number of lawns (l) that they need to mow to earn at least $1000 after
they pay for the lawn mower?
|
|
|
21.
|
The yearbook club washes cars to raise at least
$675. The club charges $4 for each car (c) that they wash. Which of these inequalities models
this situation?
|
|
|
22.
|
All of Tyler’s DVDs and videotapes are on a shelf. The inequality  represents the number of
DVDs, d, and videotapes, v, that the shelf can hold. He owns fewer videotapes than
DVDs, represented by the inequality represents the number of
DVDs, d, and videotapes, v, that the shelf can hold. He owns fewer videotapes than
DVDs, represented by the inequality  . The possible combinations of Tyler’s DVDs and
videotapes that the shelf can hold are found in which region of the graph? . The possible combinations of Tyler’s DVDs and
videotapes that the shelf can hold are found in which region of the graph? | 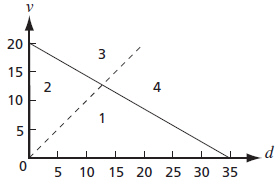 | | |
|
|
|
23.
|
Nicki makes hand-painted plates. Her overhead costs are $750 per week, and she
pays an additional $12 per plate in material costs. If Nicki sells the plates for $27 each, how many
plates does she have to sell each week at least to make a profit?
|
|
|
24.
|
Which graph best represents all the pairs of numbers ( x, y) such
that  ?
|
|
|
25.
|
Frank works at a convenience store.
He earns $7.50 per
hour when he works during the day.
He earns $12.50 per hour when he works at
night.
He wants to earn at least $300 per week.
Which graph best
represents Frank’s Weekly Earnings?
|