|
|
|
1.
|
Determine the average rate of change for the function 
between the  and  .
|
|
|
Find the sum or difference. Write the answer in simplest form.
|
|
|
2.
|
|
|
|
3.
|
|
|
|
Find the quotient. Write the answer in simplest form.
|
|
|
4.
|
|
|
|
Factor the polynomial completely.
|
|
|
5.
|
|
|
|
6.
|
|
|
|
Find the difference.
|
|
|
7.
|
|
|
|
8.
|
The graph of a function is sketched below. 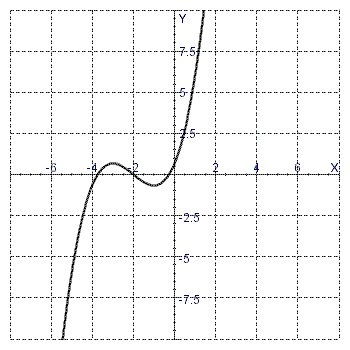 Determine the interval on which the function is decreasing. a. |  | b. | [–3,
–1] | c. | [1, 3] | d. | [–1,
–1] | e. | 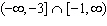 |
|
|
|
9.
|
Determine the interval on which the function in the graph below is
decreasing.  a. | [6, 10] | b. | [–7,
–3] | c. | [–2, 7] | d. | [–3, 6] | e. | [4,
–1] |
|
|
|
10.
|
An arch can be modeled by 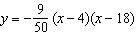 , where x and
y are measured in meters. The x-axis represents the ground. Find the width (in meters)
of the arch at ground level. 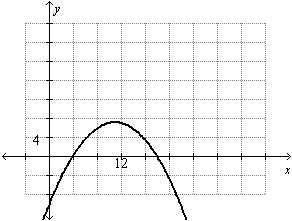
|
|
|
Solve the equation.
|
|
|
11.
|
|
|
|
12.
|
|
|
|
13.
|
|
|
|
14.
|
|
|
|
15.
|
a. | x = 0 | c. | x =
–3 | b. | x = 6.7 | d. | x = 3 |
|
|
|
Find the zeros of the function.
|
|
|
16.
|
a. | –12, 20 | c. | –1, 2, 10 | b. | 2, 10 | d. | –10, –2
|
|
|
|
17.
|
a. | 2, 6 | c. | –6, –2 | b. |  12 12 | d. |  2,
6 2,
6 |
|
|
|
Factor the polynomial completely.
|
|
|
18.
|
|
|
|
19.
|
|
|
|
Find the sum or difference. Write the answer in simplest form.
|
|
|
20.
|
|
|
|
21.
|
|
|
|
Solve the equation.
|
|
|
22.
|
|
|
|
23.
|
|
|
|
24.
|
a. | d =  , d = , d =  | c. | d = –2, d = –4 | b. | d =  , d = , d =  | d. | d =  , d = , d =  |
|
|
|
Find the sum.
|
|
|
25.
|
|
|
|
26.
|
The graph of  is shown. Use the graph to identify the
factors of  . 
|
|
|
27.
|
What is the average rate of change of the function f (x) =
x + x 2 between x = 0 and x = 5?
|
|
|
28.
|
What is the average rate of change of the function f (x) = 9
– 5x between x = 1 and x = 2?
|
|
|
Find the product.
|
|
|
29.
|
|
|
|
30.
|
|
|
|
31.
|
|
|
|
32.
|
Which equation has a solution of  ?
|
|
|
33.
|
Which statements are true about the function  ?
|
|
|
34.
|
Which expression is different?
|
|
|
35.
|
A man is running around a circular track 200 m in circumference. An observer
uses a stopwatch to time each lap, obtaining the data in the table as follows: Time (s) | Distance (m) | 30 | 200 | 68 | 400 | 114 | 600 | 168 | 800 | 230 | 1000 | 300 | 1200 | 378 | 1400 | | |
What was the man's average speed (rate)
between 68 s and 168 s?
|
|
|
Simplify each expression.
|
|
|
36.
|
|
|
|
Find the value of each expression.
|
|
|
37.
|
|
|
|
38.
|
|
|
|
39.
|
Which expression is different?
|
|
|
40.
|
The graph of a function is sketched as follows: 
|
|
|
41.
|
The graph shows the depth of water W in a reservoir over a one-year
period, as a function of the number of days x since the beginning of the year. What was the
average rate of change in W between x = 100 and x = 200? 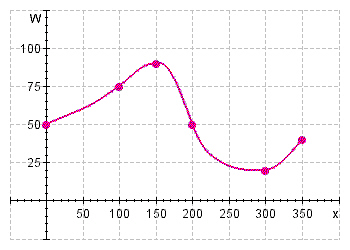
|
|
|
Find the product.
|
|
|
42.
|
|
|
|
Find the product. Write the answer in simplest form.
|
|
|
43.
|
|
|
|
Use the Distributive Property to write each expression as an equivalent
expression. Then evaluate it.
|
|
|
44.
|
|
|
|
Solve each equation.
|
|
|
45.
|
|
|
|
Choose the quadratic function in standard form whose graph satisfies the
given condition(s).
|
|
|
46.
|
x-intercepts: –1 and –5
|