Unit 5.2 - Activity 5-8C
Short-Run Phillips Curve
When the economy of the 1970s experienced high inflation and high unemployment at the same time (i.e., stagflation) the Phillips curve relationship no longer appeared to be true. Eventually, additional data showed that the negative relationship between the inflation rate and the unemployment rate still held, but that the short-run Phillips curve had shifted to the right, as shown in Figure 5-8.3. The rightward shift of the short-run Phillips curve was due to a negative supply shock—a decrease in aggregate supply caused by an increase the price of oil. A positive supply shock (e.g., an advance in technology) will shift the short-run Phillips curve to the left. A negative (positive) supply shock means that for every given unemployment rate, the corresponding inflation rate is higher (lower).
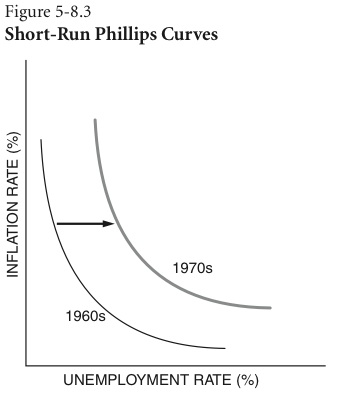
Data from the 1960s appeared to support the Phillips curve relationship. When inflation was low, the unemployment rate was high. The Phillips curve suggested that when the unemployment rate is higher than the natural rate of unemployment and the economy is not operating at its potential gross domestic product (GDP), decreasing unemployment would lead to higher inflation.
This quiz is timed.
The total time allowed for this quiz is 15 minutes. |
This quiz requires you to log in.
Please enter your Quia username and password. |
|
|
|