| A | B |
|---|
| The movement of organisms into a given area from another area is called ____. | immigration |
| When organisms leave a certain area, the movement is called ___. | emigration |
| For a population to grow, the ____ must be bigger than the ____ | birthrate must be larger than the deathrate (assuming no immigration or emigration) |
| The number of individuals per unit area is a population’s ____. | density |
| Logistic growth occurs when a population’s growth __________ , after a period of rapid growth. | slows down or stops |
| Under ideal conditions with unlimited resources, a population will grow _____. | exponentially |
| The graph of exponential population growth is describes as a(n) _____-shaped curve. | J-shaped curve |
| The graph of logistical population growth is described as a(n) _____-shaped curve. | S-shaped curve |
Which type of population growth does this graph show?,  | This graph shows exponential growth, which only happens under ideal conditions with unlimited space, food and no predators.,  |
Which type of population growth does this graph show?,  | Logistic growth,  |
At which point in the graph below is the population growth rate accelerating?,  | Point A,  |
At which point in the graph below is the population growth rate the highest?,  | The population growth "rate" is the highest at point B,  |
At which point in the graph below is the population growth rate starting to slow down?,  | Point C,  |
At which point in the graph below is the population the highest?,  | The population is the highest at point D (look along the y-axis),  |
At which point on the graph below is the population growth rate the lowest?,  | The population growth rate is lowest at point D (notice that the population, even though it is at its highest, has stopped growing),  |
At which point in the graph below is the population at the carrying capacity?,  | The population has reached the carrying capacity at point D. Remember, the carrying capacity is the maximum number of individuals that the environment can support.,  |
| The scientific study of human populations is called ___. | demography |
| What happened to human population growth around 1650 A.D.? | Human population started growing more rapidly. |
| In human populations, ____ is a change from high birth rates and high death rates to low birth rates and low death rates. | demographic transition |
| In human populations, the first stage of demographic transition is characterized by ___. | low death rate and high birth rate (Before the transition starts, you have high birth rates and high death rates. Third world countries start the demographic transition when health care and sanitation improve, decreasing the death rate) |
| In human populations, demographic transition begins changes in society that ___. | lower the death rate |
Which of these two age structure diagrams shows the typical human age structure of a typical third-world country?,  | A,  |
Which of these two age structure diagrams shows the typical human age structure of a first world modernized country?,  | B,  |
The age structure diagram on the left shows a ____ birth rate and a ____ death rate.,  | high birth rate and high death rate.,  |
The age structure diagram on the right shows a ____ birth rate and a ____ death rate.,  | low birth rate and low death rate.,  |
| _____ is the pattern of spacing among individuals within the boundaries of the population. | Dispersion |
| Which two techniques for estimating population size are most commonly used by scientists? Under what circumstances would you use each one? | The sample plot method is used when the organisms are unlikely to move much (like trees). The mark-recapture method is used when individuals move about frequently (like fish). It is highly recommended that you do the first activity on the CD for chapter 52 to help you learn each method. You will be tested on them. |
| What is a possible source of error that must be taken into consideration when using the mark-recapture method for estimating population size? | A potential source of error for the mark-recapture method is the possibility that already marked individuals may be less likely to be trapped again if they become wary of the traps. |
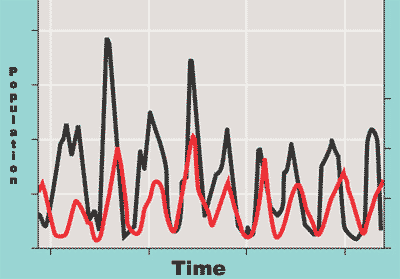
The graph below shows population fluctuation typical of a _____ relationship.,  | predator-prey,  |
Which country below is likely to experience a decline in population due to its age structure?,  | Italy. Notice the small percentage of young people in the population. As they reach child-baring age, the countries birth rate is likely to fall. Conversely, Afghanistan has a large proportion of it's population in child-baring or soon to be child-baring age categories and will likely see rapid population growth unless war and famine cause the death rate to match the birth rate.,  |
Which type of dispersion pattern is shown below and which factors may account for this type of dispersion?,  | Clumped dispersion. Communal living explains clumped dispersion in wolf populations. Other types of organisms may be clumped in particular microhabitats, such as fungi. The mating habits of certain insects may explain a swarm that clumps large numbers of individuals together.,  |
Which type of dispersion pattern is shown below and which factors may account for this type of dispersion?,  | Uniform dispersion. Organisms that exhibit territoriality, or plants that give off chemicals to inhibit growth of neighboring plants often times have uniform distribution.,  |
Which type of dispersion pattern is shown below and which factors may account for this type of dispersion?,  | Random dispersion. Occurs in the absence of strong attraction or repulsion among individuals in the population or a uniform environment. In this case, the dandelions seeds were blown randomly across the field.,  |
| A life history in which adults produce large numbers of offspring over many years is called _____ or ______. | iteroparity or repeated reproduction |
| The study of how complex interactions between biotic and abiotic factors influence variations in population size. | population dynamics |
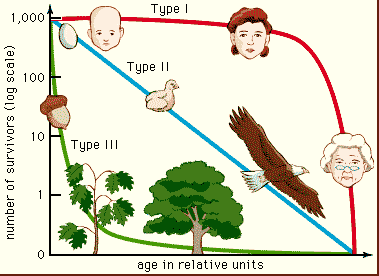
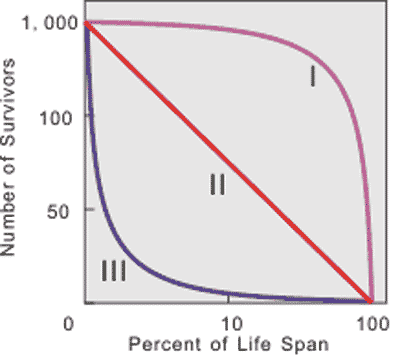
| A plot of the number of members of a cohort that are still alive at each age: one way to represent age-specific mortality. | survivorship curve,  |
Which survivorship curve would represent the human species? Which would represent a typical fish species?,  | Humans would be type one due to their fairly high infant survival rate. Fish would be type III because most lay many eggs and generally don't guard them or protect the juveniles, so most fish are eaten when they are small, if they even manage to make it out of their egg.,  |
| Selection that favors life history traits that maximize reproduction in uncrowded environments are called ____ or ____. | r-selection or density-independent selection |
| Selection that favors life-history traits that allow for survival under crowded competitive conditions is known as ____ or ____. | K-selection or density-dependent selection |
| A period of stability in population size, when the per capita birth rate and death rate are equal. | Zero population growth (ZPG) |
| The maximum population size that can be supported by the available resources, symbolized as K. | carrying capacity |
| A method to use multiple constraints to estimate the human carrying capacity of Earth by calculating the aggregate land and water area in various ecosystem categories that is appropriated by a nation to produce all the resources it consumes and to absorb all the waste it generates. | ecological footprint |
| The series of events from birth through reproduction and death. | life history |
| A group of populations that are linked due to high rates of emigration and immigration. | meta-population |
| The actual resource base of a country. | ecological capacity |
| The study of populations in relation to the environment, including environmental influences on population density and distribution, age structure, and variations in population size. | population ecology |
| A dispersion pattern in which individuals are aggregated in patches. | clumped dispersion |
| Referring to any characteristic that varies according to an increase in population density. | density-dependent |
| A model describing population growth that levels off as population size approaches carrying capacity. | logistic population growth |
| A behavior in which an animal defends a bounded physical space against encroachment by other individuals, usually of its own species. | territoriality |
| A group of individuals of the same age, from birth until all are dead. | cohort |
| The study of statistics relating to births and deaths in populations. | demography |
| A life history in which adults have but a single reproductive opportunity to produce large numbers of offspring is called _____ or ______. | semelparity or big-bang reproduction |
| The number of infant deaths per 1,000 live births is referred to as _____. | infant mortality |
| Referring to any characteristic that is not affected by population density. | density-independent |
| The relative number of individuals of each age in a population is known as the population's _____. | age structure |
| Disease is a _____ factor that limits population growth. | density dependent |
| Harsh winters would be considered as ______ factors that limit population growth. | density independent |
| Situations in which a population that is too small makes it harder for the remaining individuals to survive, such as a lone tree now exposed to high winds, or an animal that has a hard time finding a mate, is called the ____ effect. | Allee effect |