| A | B |
|---|
| Bar Graph | A bar chart or bar graph is a chart with rectangular bars with lengths proportional to the values that they represent.,  |
| Cause | A person or thing that acts, happens, or exists in such a way that some specific thing happens as a result; the producer of an effect,  |
| Condensation | The change from the gaseous to the liquid state of matter., 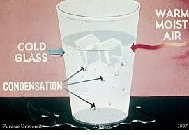 |
| Effect | Something that is produced by an agency or cause; result; consequence,  |
| Favored | enjoying special advantages; privileged,  |
| Hertz (Hz) | Unit of measurement for frequency., 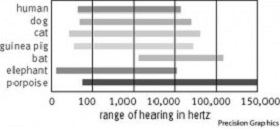 |
| Intensity | The amount of energy per second carried through a unit area by a wave.,  |
| Liter | A unit of capacity redefined in 1964 by a reduction of 28 parts in a million to be exactly equal to one cubic decimeter. It is equivalent to 1.0567 U.S. liquid quarts and is equal to the volume of one kilogram of distilled water at 4°C.,  |
| Mirage | An image of a distant object caused by refraction of light as it travels air of varying temperature., 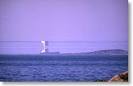 |
| Precision | Mechanical or scientific exactness: a lens ground with precision, 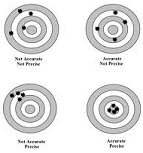 |
| Refrigeration | The storing of food at cold temperatures to slow the growth of harmful bacteria., 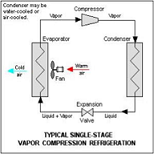 |
| Scientific Theory | A well- tested idea that explains and connects a wide range of observations.,  |
| System | A group of related elements or parts that work together for a common purpose,  |
| Transistor | A devise that either amplifies an electronic signal or switches current on and off., 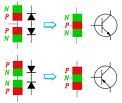 |
| Wide Area Network | (WAN) A system of computers connected across large distances.,  |
