| A | B |
|---|
arc,  | Part of a circle, from one point on the circle to another. |
area, 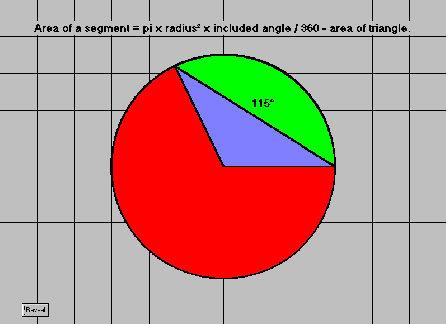 | The amount of surface inside a closed boundary. Area is measured in square units, such as square inches or square centimeters. |
bar graph,  | A graph that uses horizontal or vertical bars to represent the data. |
| biased sample | a sample that does not fairly respresent the total population from which it was selected. |
| broken-line graph | same as a line graph. |
| circle | The set of all points in a plane that are the same distance from a fixed point in the plane. The fixed point is the center of the circle, and the distance is the radius. |
circle graph, 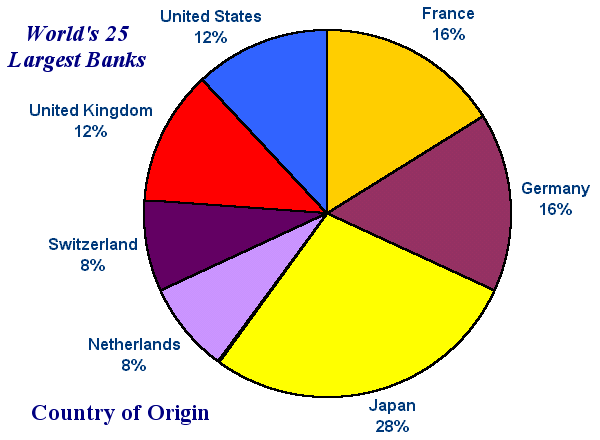 | A graph in which a circle and its interior are divided by radii into parts. Same as pie graph. |
| double-stem plot | a stem-and-leaf plot in which each stem is split into two parts. |
| landmark | A notable feature of a data set. Landmarks include the median, mode, maximum, minimum, and range. The mean can also be thought of as a landmark. |
line plot,  | A sketch of data in which check marks, Xs, or other marks above a labeled line show the frequency of each value. |
| line graph | a graph in which data points are connected by line segments |
| maximum | The largest amount; the greatest number in a set of data. |
| median | The middle value in a set of data when the data are listed in order from smallest to largest. |
| minimum | The smallest amount; the smallest number in a set of data. |
| mode | The value or values that occur most often in a set of data. |
| mystery plot | An unlabeled graph or plot. |
percent circle,  | A tool on the Geometry Template that is used to measure and draw figures that involve percents. |
| perimeter | The distance around a 2-dimensional shape. The perimeter of a circle is called its circumference. A formula for the perimeter P of a rectangle with length l and width w is p = 2 * (l + w). |
| radius (plural: radii) | A line segment from the center of a circle (or sphere) to any point on the circle (or sphere). |
| random sample | A sample that gives all members of the population the same chance of being selected. |
| range | The difference between the maximum and the minimum in a set of data. |
| recall survey | a survey used to collect information about past behaviors, habits, or activities. |
| sample | A part of a group chosen to represent the whole group. |
| sector | A region bounded by an arc and two radii of a circle. |
| side-by-side bar graph | a bar graph that uses pairs of bars to compare two related data sets. |
| stacked bar graph | a graph in which the bars are subdivided to show additional information |
| stem-and-leaf plot | A display of data in which digits with larger place values are “stems” and digits with smaller place values are “leaves.” |
| step graph | A graph that looks like steps because the y values are the same for an interval of x values, then change (or “step”) for the next interval of x values. |
| box and whisker plot | a plot displaying the spread or distribution of a data set using five landmarks (min., lower quartile, median, upper quartile, max.) |
| lower quartile | In an ordered data set, the middle value of the data below the median. |
| upper quartile | In an ordered data set, the middle value of the data above the median. |
| interquartile range (IQR) | The length of the interval between the lower and upper quartiles in a data set. |
