| A | B |
|---|
| population | a group of organisms that belong to the same species and live in a particular area |
| the three properties of a population | size, density, dispersion |
| the three factors scientists look at with studying population size | birth rate, death rate, life expectancy |
| age structure | the distribution of individuals among different ages in a population |
| survivorship curve | a series of three curves that show the probability that members of a population will survive to a certain age |
| type I survivorship curve | probability of dying is small until later in life |
| type II survivorship curve | probability of dying does not change over time |
| type III survivorship curve | the probability of dying young is very high, but if an organism survives, they will likely live until old age |
| type I survivorship curve- graph structure |  |
| type II survivorship curve- graph structure | 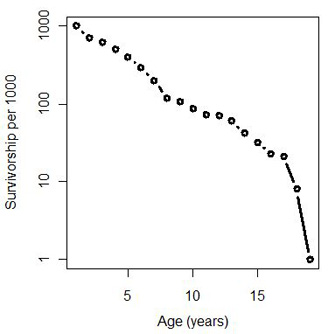 |
| type III survivorship curve- graph structure | 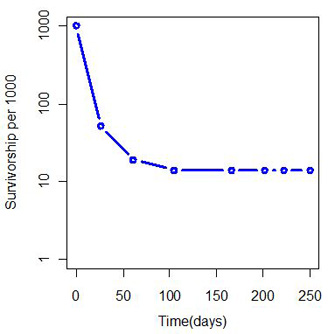 |
| age structure--> what does the graph look like? | 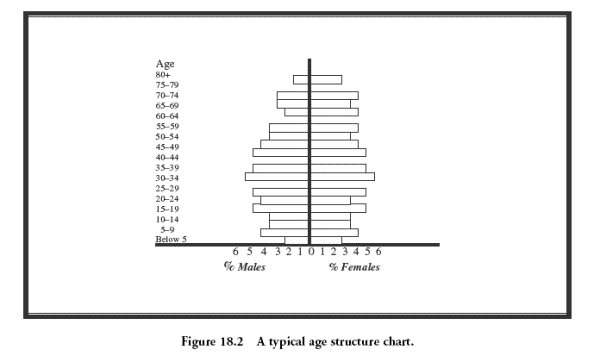 |
