Home
FAQ
About
Log in
Subscribe now
Java Games:
Flashcards, matching, concentration, and word search.
Bar Graphs and Line Graphs
Tools
Copy this to my account
E-mail to a friend
Find other activities
Start over
Help
Pair each graph to its picture.
A
B
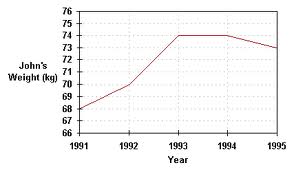
A line graph, such as this shows change over time.,
This double bar graph shows comparison of two items.,
This image shows John's weight at 70 kg in 1992
This image shows an equal number of students who like softball.,
Lynne Hampson
Send e-mail
This activity was created by a Quia Web subscriber.
Learn more about Quia
Create your own activities