| A | B |
|---|
| bar graph | shows category data, 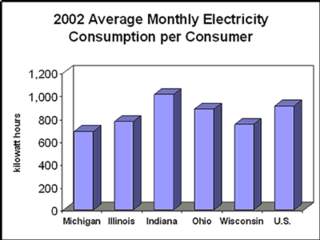 |
| circle graph | shows part-to-whole, 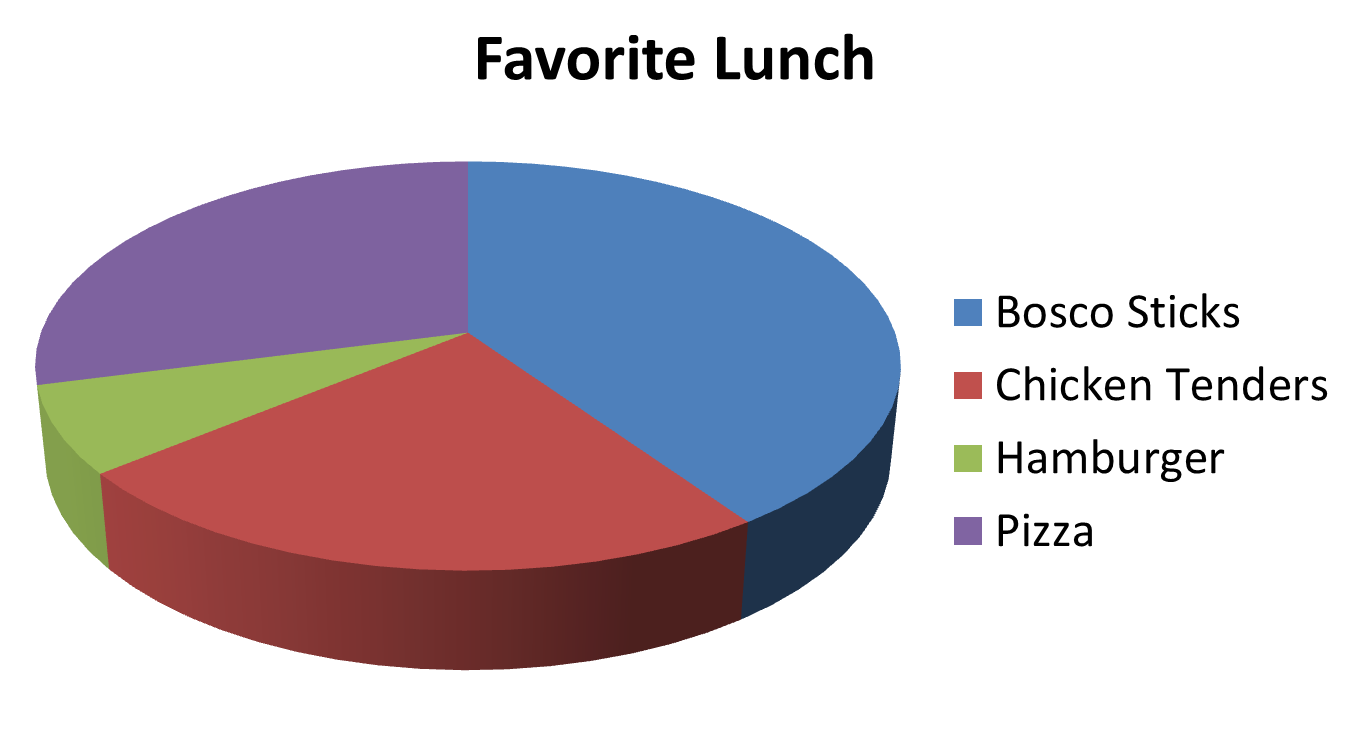 |
| line graph | shows a 1-to-1 change,  |
| table | lists data in order, 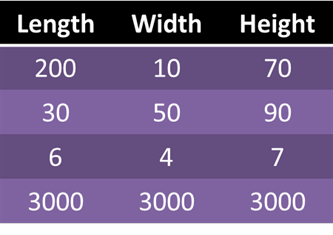 |
| scatter plot | shows data points that may vary,  |
| mean | average-the sum of data values divided by the number of data values |
| median | the middle value in a set |
| mode | the value in a set that is repeated the most |
| range | highest value - lowest value |
| spread | how much a data set varies |
| maxima | the highest value(s) |
| minima | the lowest value(s) |
| scale | the steps in numbering on the axis of a graph |
| slope | the change in y over the change in x values |
| origin | the point where the x and y axes cross |
| x-axis | the horizontal base line of a graph |
| independent variable | the data value that is not changed by the other value |
| dependent variable | the data value that may change due to the other data value |
| y-axis | the vertical axis in a graph |
