| A | B |
|---|
| Scatter Plot | Set of points used to determine the association between x and y |
| Association | Relationship between two sets of data |
| Positive Association | 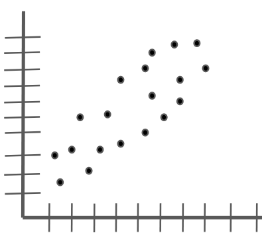 |
| Negative Association | 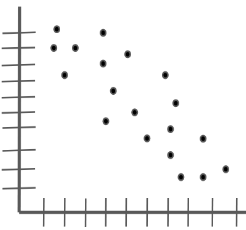 |
| No Assossciation | 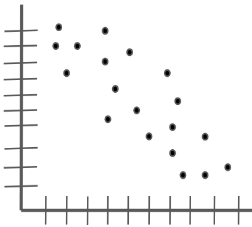 |
| Linear Model | 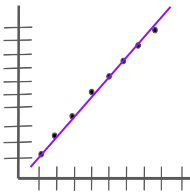 |
| Quartiles | Uses Median to help divide data into 4 parts |
| Trend | Pattern that is shown by the data |
| Plane | The flat surface that extends forever in all directions |
| Coordinate | Pair of numbers that tells us where a point is located |
| Quadrant | There are 4 of these on the coordinate plane |
