| A | B |
|---|
a graph that uses bars to show comparisons between categories of data,  | bar graph |
| facts and information used to analyze something | data |
| a chart with rows and tables used to organize information | table |
| a graphical or visual display of information | chart |
a graph in which a circle is divided into sections that each represent a proportion of the whole, 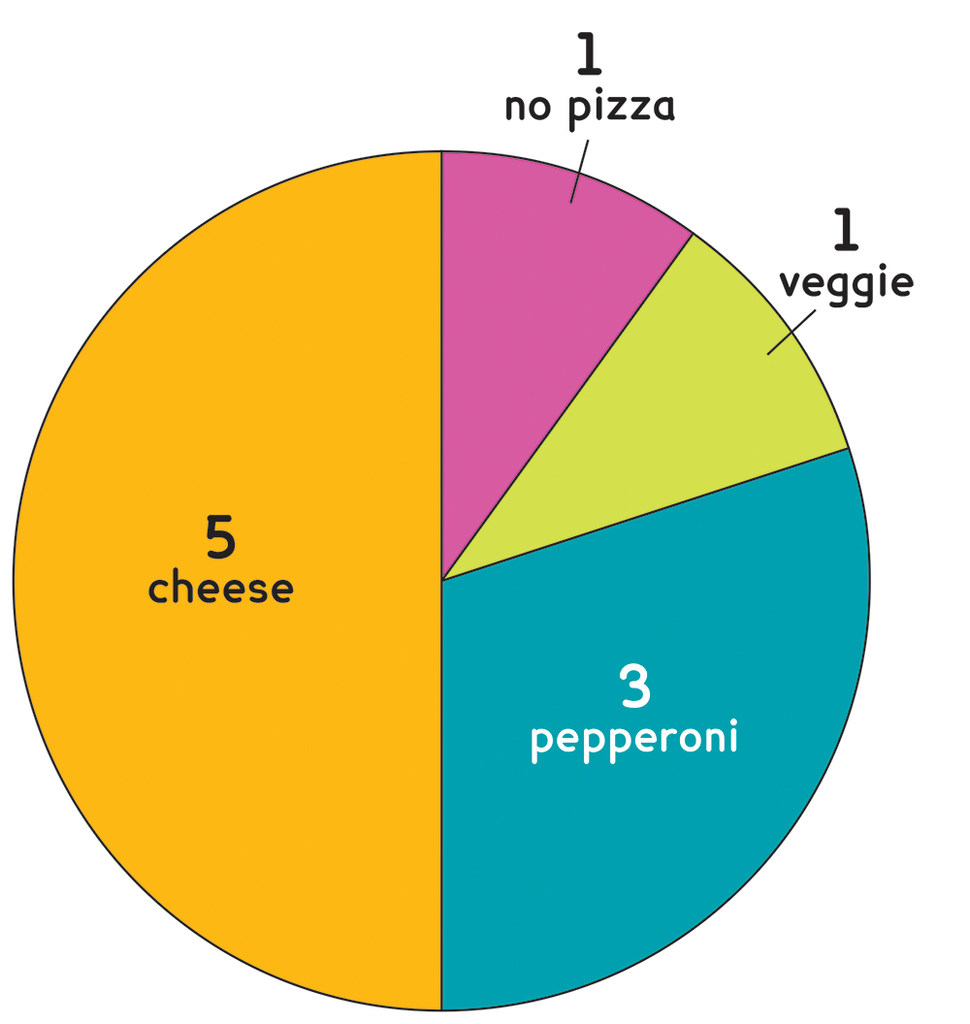 | pie chart |
| This helps to see the differences in data on a graph or chart | using colors |
a graph that connects data points., 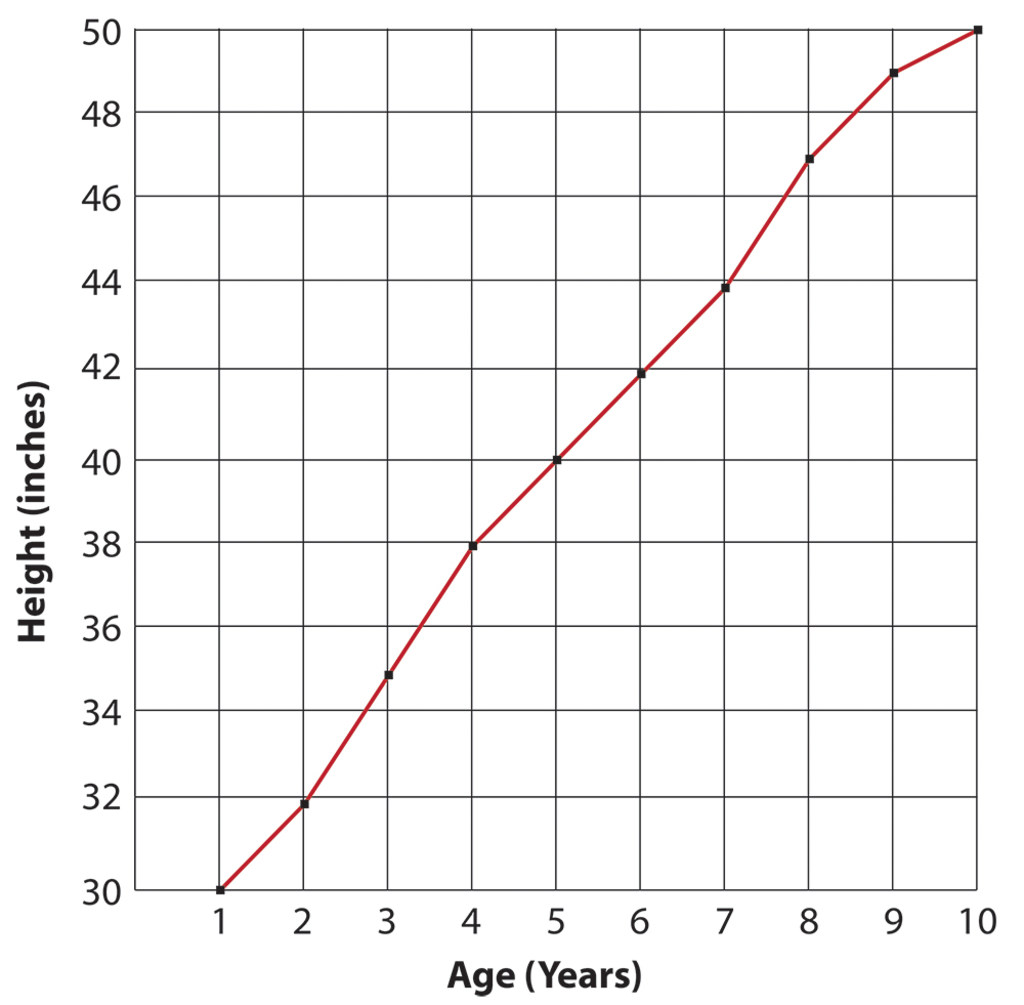 | line graph |
| Line charts use a single line to _________ | show & link all data points together |
| Pie charts are a great way to show data ______ | as part of a whole |
| A line graph is best used for data that happens over _____ | time |
