 |
Java Games: Flashcards, matching, concentration, and word search. |
 |
|
| A | B |
|---|
| Movement along the demand or supply curve | Demonstrates Price Effect |
Chart B, 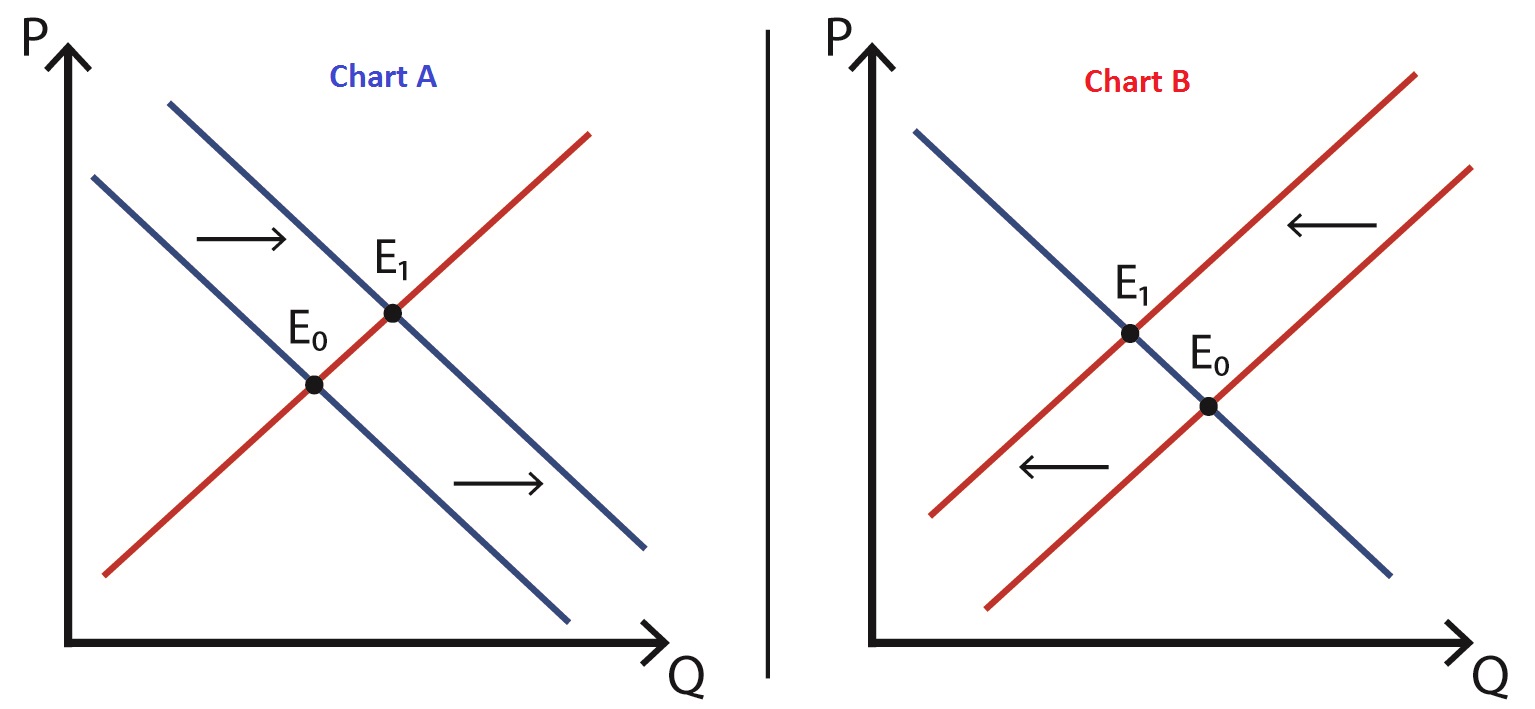 | Shows a decrease in supply and an increase in the market clearing price |
| Chart A, | Shows an increase in demand and market clearing price |
Price Floor, 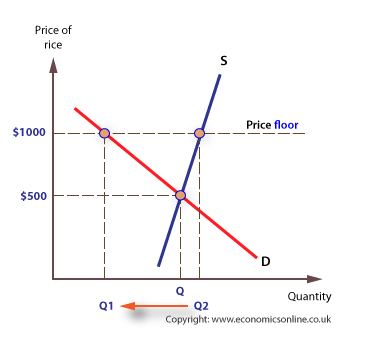 | Creates more supply because of an artificially high price |
Price Ceiling, 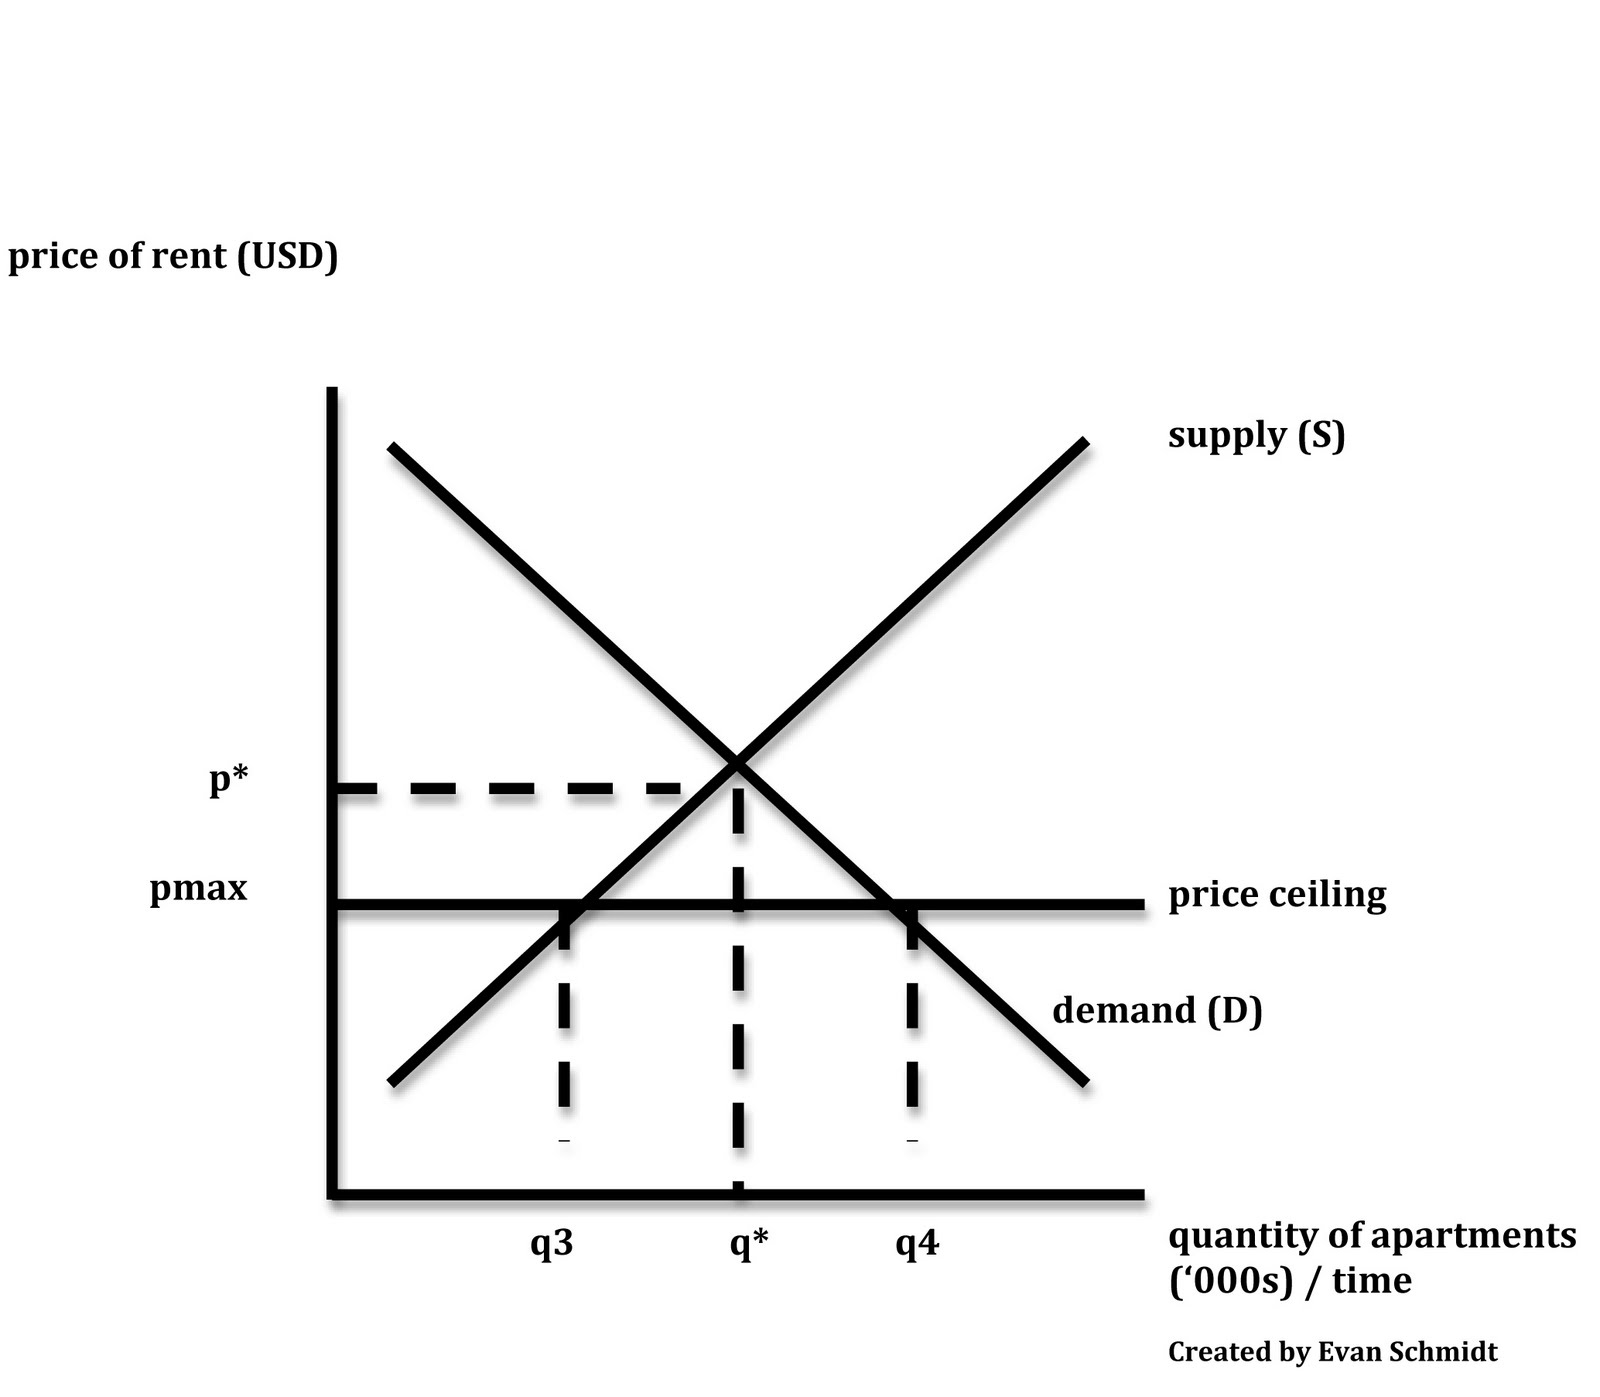 | Artificially high demand because price is held down |
Area B represents,  | Surplus |
| Area A represents, | Shortage |
Intersection of Supply and Demand, 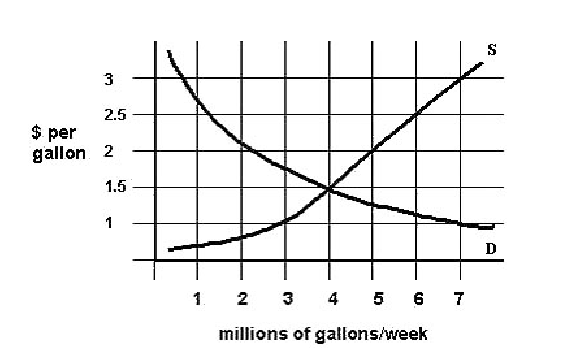 | Market Clearing Price (Equilibrium) |
|
| |
