 |
Java Games: Flashcards, matching, concentration, and word search. |
 |
|
| A | B |
|---|
spreadsheet,  | A program used to make calculations and forms – used to organize and analyze data |
row, 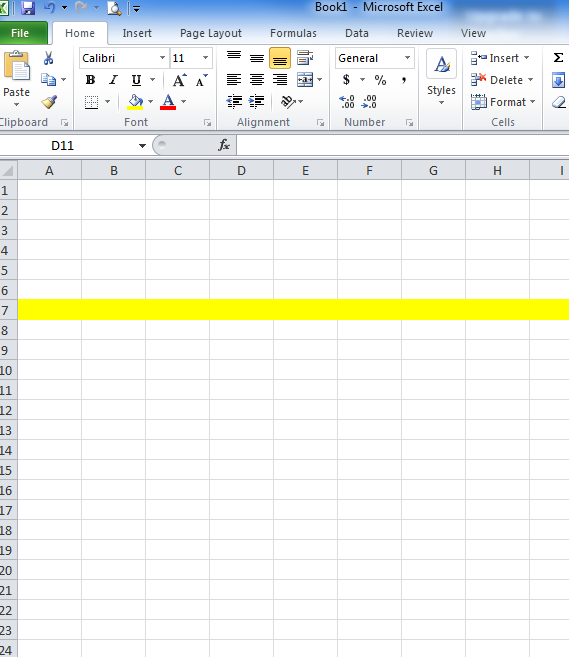 | The boxes going across the page (numbered from 1 - ???) |
column, 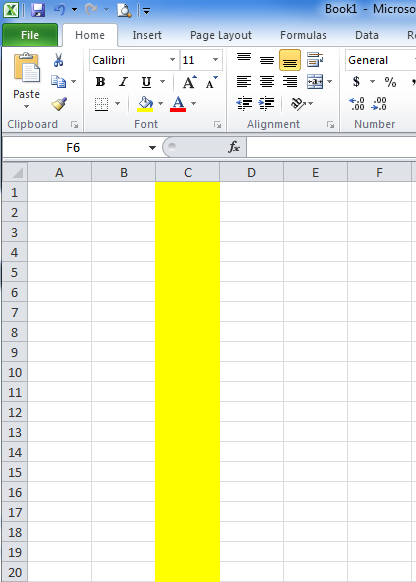 | The boxes going up and down on the page (lettered from A - ???) |
formula, 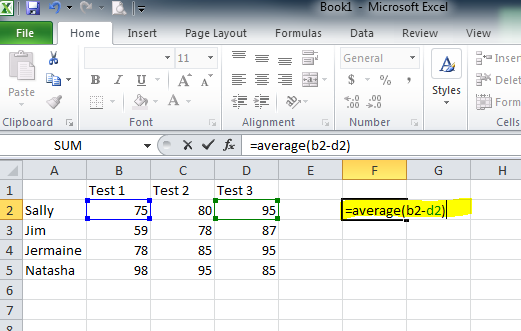 | an equation for the computer to use in a spreadsheet |
autosum, 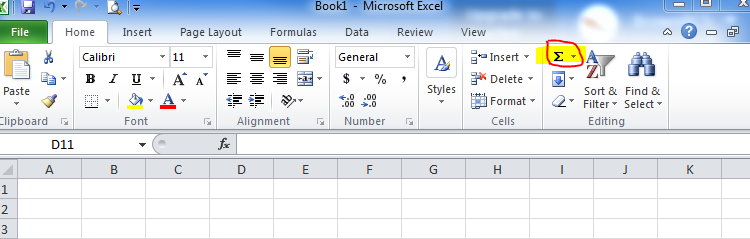 | automatically totals the contents of cells |
label, 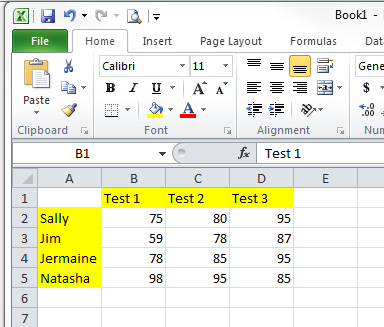 | text in a cell usually describing the data in the rows and columns surrounding it |
value, 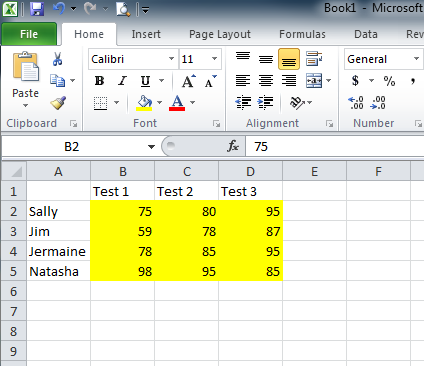 | numbers entered into a cell to be used in a part of a calculation, such as addition or multiplication |
Pie graph, 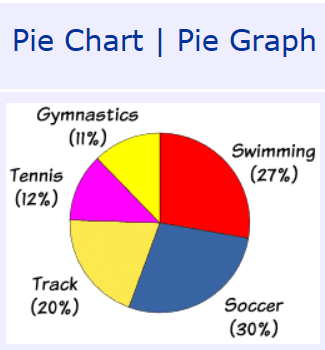 | a circular chart divided into sectors, each sector shows the relative size of each value. |
line graph, 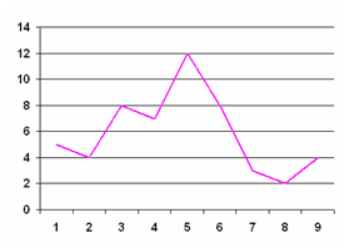 | A graph that uses points connected by lines to show how something changes in value (as time goes by, or as something else happens). |
column graph, 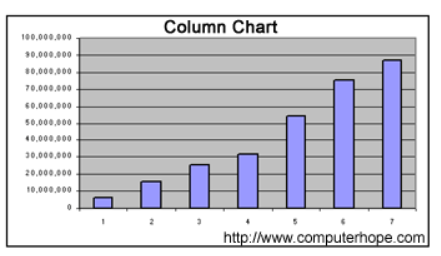 | A graphic representation of data displayed vertically |
bar graph,  | A graphic representation of data displayed horizontally |
active cell, 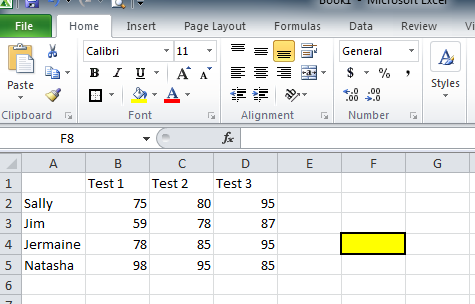 | cell surrounded by a thick black border when the information you type in is displayed |
cell, 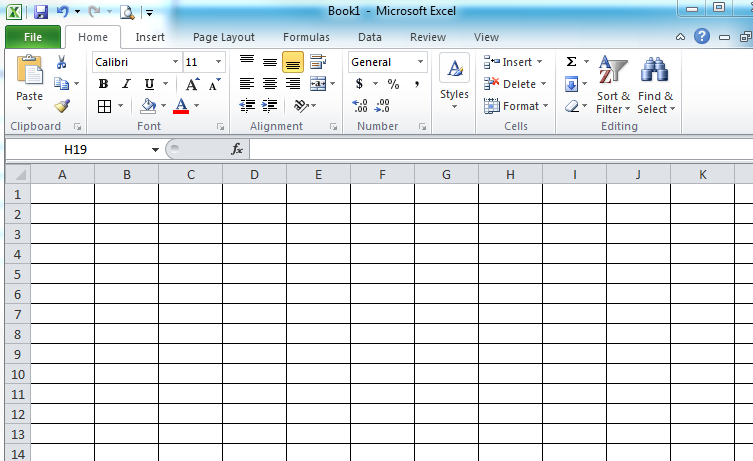 | the intersection of a row and a column in a spreadsheet or table |
|
|
|

|
|
|
Cousins Middle School |
| Covington, GA |
|
|
|
|
|
| |