Unit 5.2 - Activity 5-8
Short-Run Phillips Curve
The Phillips curve relationship was first proposed by A. W. Phillips in 1958. Following up on Phillips’s research, other economists found an inverse relationship between the inflation rate and the unemployment rate. In other words, when inflation increased, the unemployment rate decreased, and when inflation decreased, the unemployment rate increased. A graphic representation of this trade-off became known as the Phillips curve.
Student Alert: Pay close attention to the axes when you graph Phillips curves!
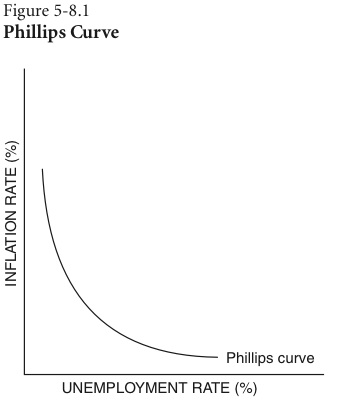
Data from the 1960s appeared to support the Phillips curve relationship. When inflation was low, the unemployment rate was high. The Phillips curve suggested that when the unemployment rate is higher than the natural rate of unemployment and the economy is not operating at its potential gross domestic product (GDP), decreasing unemployment would lead to higher inflation.
|
|
|